The Coming Famine
By Peter Goodchild
http://www.survivepeakoil.blogspot.ca/2016/02/the-coming-famine.html

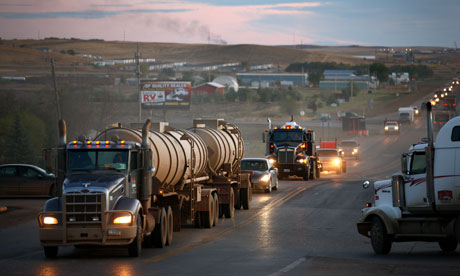
Humanity has struggled to survive through the millennia in terms of Nature's tendency to balance population size with food supply. The same is true now, but population numbers have been soaring for over a century. Oil, the limiting factor, is close to or beyond its peak extraction. Without ample, free-flowing oil, it will not be possible to support a population of several billion for long. Without fossil fuels for fertilizer and pesticides, as well as for cultivating and harvesting, crop yields drop by more than two-thirds (Pimentel, 1984; Pimentel & Hall, 1984; Pimentel & Pimentel, 2007).
Over the next few decades, there will be famine on a scale many times larger than ever before in human history. It is possible, of course, that warfare and plague, for example, will take their toll to a large extent before famine claims its victims. The distinctions, in any case, can never be absolute: often "war + drought = famine" (Devereux, 2000, p. 15), especially in sub-Saharan Africa, but there are several other combinations of factors.

Although, when discussing theories of famine, economists generally use the term "neo-malthusian" in a derogatory manner, the coming famine will be very much a case of an imbalance between population and resources. The ultimate cause will be fossil-fuel depletion, not government policy (as in the days of Stalin or Mao), warfare, ethnic discrimination, bad weather, poor methods of distribution, inadequate transportation, livestock diseases, or any of the other variables that have often turned mere hunger into genuine starvation.
The increase in the world’s population has followed a simple curve: from about 1.7 billion in 1900 to over 7 billion today. A quick glance at a chart of world population growth, on a broader time scale, shows a line that runs almost horizontally for thousands of years, and then makes an almost vertical ascent as it approaches the present. That is not just an amusing curiosity. It is a shocking fact that should have awakened humanity to the realization that something is dreadfully wrong.
Mankind is always prey to its own "exuberance," to use Catton’s term. That has certainly been true of population growth. In many cultures, "Do you have any children?" or, "How many children do you have?" is a form of greeting or civility almost equivalent to "How do you do?" or, "Nice to meet you." World population growth, nevertheless, has always been ecologically hazardous. With every increase in human numbers we are only barely able to keep up with the demand: providing all those people with food and water has not been easy. We are always pushing ourselves to the limits of Earth’s ability to hold us (Catton, 1982).

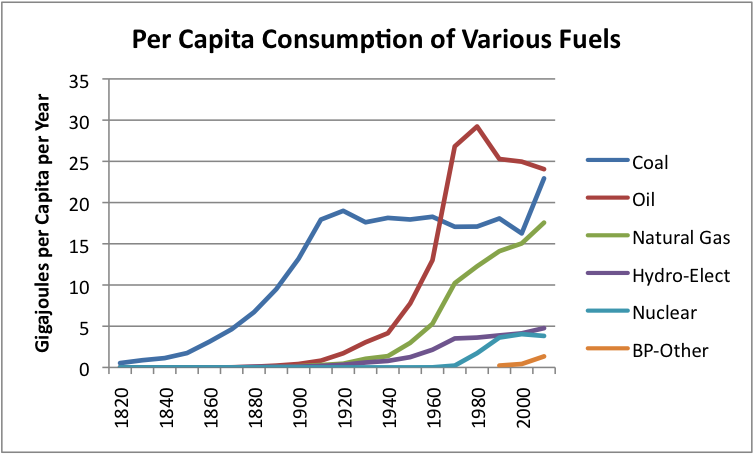
Even that is an understatement. No matter how much we depleted our resources, there was always the sense that we could somehow "get by." But in the late twentieth century we stopped getting by. It is important to differentiate between production in an "absolute" sense and production "per capita." Although oil production, in "absolute" numbers, kept climbing -- only to decline in the early twenty-first century -- what was ignored was that although that "absolute" production was climbing, the production "per capita" reached its peak in 1979 (BP, annual).
The unequal distribution of resources plays a part. The average inhabitant of the US consumes far more than the average inhabitant of India or China. Nevertheless, if all the world’s resources were evenly distributed, the result would only be universal poverty. It is the totals and the averages of resources that we must deal with in order to determine the totals and averages of results. For example, if all of the world’s arable land were distributed evenly, in the absence of mechanized agriculture each person on the planet would still have an inadequate amount of farmland for survival: distribution would have accomplished very little.
We were always scraping the edges of the earth, but we are now entering a far more dangerous era. The main point to keep in mind is that, throughout the twentieth century, while population was going up, so was oil production. Future excess mortality can therefore be determined -- at least in a rough-and-ready manner -- by the fact that in modern industrial society it is largely the oil supply that determines how many people can be fed.

There is no precise causal relation, of course, between oil production and famine. To suggest such a thing would conflict with other ways of estimating future population. Another figure, closely related, might be the ratio of population to arable land. Even then, the history of famine does not suggest an exact correlation between population and arable land; certainly in the 1950s there were major famines although the world population was only a third of that today. Ó Gráda claims that the worst famines in recent times were actually in countries which rate relatively well in terms of the ratio of population to arable: Angola, Ethiopia, Somalia, Mozambique, Afghanistan, and Sudan. In fact famine, at least up to the present time, seems to have been more related to politics than to arable land or other resources.

Famine will also cause a lowering of the birth rate (Devereux, 2000; Ó Gráda, 2007, March). This will sometimes happen voluntarily, as people realize they lack the resources to raise children, or it will happen involuntarily when famine and general ill health result in infertility. In most famines the number of deaths from starvation or from starvation-induced disease is very roughly the same as the number of lost or averted births. In Ireland’s nineteenth-century famine, the number of famine deaths was 1.3 million, whereas the number of lost births was 0.4 million. The number of famine deaths during China’s Great Leap Forward (1958-1961), however, was perhaps 30 million, and the number of lost births was perhaps 33 million.
The "normal," non-famine-related, birth and death rates are not a factor in determining the future population figures, since for most of pre-industrial human history the sum of the birth and death rates -- in other words, the growth rate -- has been nearly zero: 2,000 years ago the global population was about 300 million, and it took 1,600 years for the population to double. If not for the problem of resource-depletion, in other words, the future birth rate and death rate would be nearly identical, as they were in pre-industrial times. (And there is no question that the future will mean a return to the "pre-industrial.")
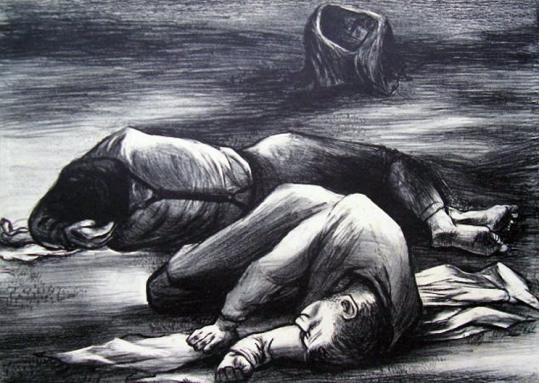 Nevertheless, it will often be hard to separate "famine deaths" from a rather broad category of "other excess deaths." War, disease, and other factors will have unforeseeable effects of their own. Considering the unusual duration of the coming famine, and with Leningrad (Salisbury, 2003) as one of many precursors, cannibalism may be significant; to what extent should this be included in the calculation of "famine deaths"? In any case, it is probably safe to say that an unusually large decline in the population of a country will be the most significant indicator that this predicted famine has in fact arrived.
We must ignore most previous estimates of future population growth. Instead of a steady rise over the course of this century, as generally predicted, there will be a clash of the two giant forces of overpopulation and oil depletion, followed by a precipitous ride into an unknown future.
We are ill-prepared for the next few years. The problem of oil depletion turns out to be something other than a bit of macabre speculation for people of the distant future to deal with, but rather a sudden catastrophe that will only be studied dispassionately long after the event itself has occurred. Doomsday will be upon us before we have time to look at it carefully.
The world has certainly known some terrible famines in the past. In recent centuries, one of the worst was that of North China in 1876-79, when between 9 and 13 million died, but India had a famine at the same time, with perhaps 5 million deaths. The Soviet Union had famine deaths of about 5 million in 1932-34, purely because of misguided political policies. The worst famine in history was that of China’s Great Leap Forward, 1958-61, when perhaps 30 million died, as mentioned above.
A closer analogy to the coming "petroleum famine" may be Ireland’s potato famine of the 1840s, since -- like petroleum -- it was a single commodity that caused such devastation (Woodham-Smith, 1962). The response of the British government at the time can be summarized as a jumble of incompetence, frustration, and indecision, if not outright genocide, and the same may be true of any future responses by government.
 As previously mentioned, population is not tied with mathematical precision to oil production; the latter provides only a rough indication of the former. To some extent, people will learn to live with less. Certainly most westerners can cut their living standards considerably and still live healthy lives -- perhaps even healthier, since they would be eating less and walking more. People will also switch to other sources of energy: in particular, firewood can replace fossil fuels for heating, though the amount of wood will not be sufficient for billions of people. All these adjustments will alleviate matters for a while, although the basic problem will remain: that fossil fuels will decline at a much faster rate than any voluntary reduction in births.
The above predictions can be nothing more than approximate, but even the most elaborate mathematics will not entirely help us to deal with the great number of interacting factors. We need to swing toward a more pessimistic figure for humanity’s future if we include the effects of war, disease, and so on. One of the most serious negative factors will be largely sociological: To what extent can the oil industry maintain the advanced technology required for drilling ever-deeper wells in ever-more-remote places, when that industry will be struggling to survive in a milieu of social chaos? Intricate division of labor, large-scale government, and high-level education will no longer exist.
On the other hand, there are elements of optimism that may need to be plugged in. We must not forget the sheer tenacity of the human species: we are intelligent social creatures living at the top of the food chain, in the manner of wolves, yet we outnumber wolves worldwide by about a million to one; we are as populous as rats or mice. We can outrace a horse over long distances. Even with Stone-Age technology, we can inhabit almost every environment on Earth, even if most of the required survival skills have been forgotten.
Specifically, we must consider the fact that neither geography nor population is homogeneous. All over the world, there are forgotten pockets of habitable land, much of it abandoned in the modern transition to urbanization, for the ironic reason that city dwellers regarded rural life as too difficult, as they traded their peasant smocks for factory overalls. There are still areas of the planet’s surface that are sparsely occupied although they are habitable or could be made so, to the extent that many rural areas have had a decline in population that is absolute, i.e. not merely relative to another place or time. By careful calculation, therefore, there will be survivors. Over the next few years, human ingenuity must be devoted to an understanding of these geographic and demographic matters, so that at least a few can escape the tribulation. Neither the present nor future generations should have to say,
"We were never warned."
"We were never warned."
 |
| Add caption |
References:
BP. Global statistical review of world energy. (annual). Retrieved fromhttp://www.bp.com/statisticalreview
Catton, W. R., Jr. (1982). Overshoot: The ecological basis of revolutionary change. Champaign, Illinois: University of Illinois Press.
Devereux, S. (2000). Famine in the twentieth century. IDS Working Paper 105. Retrieved fromhttp://www.sarpn.org.za/documents/d0000076/Devereux.pdf
Ó Gráda, C. (2007, March). Making famine history. Journal of Economic Literature. Retrieved from http://www.ucd.ie/economics/research/papers/2006/WP06.10.pdf
Pimentel, D. (1984). Energy flows in agricultural and natural ecosystems. CIHEAM (International Centre for Advanced Mediterranean Agronomic Studies). Retrieved fromhttp://www.ressources.ciheam.org/om/pdf/s07/c10841.pdf
------, & Hall, C. W., eds. (1984). Food and energy resources. Orlando, Florida: Academic Press.
------, & Pimentel, M. H. (2007). Food, energy, and society. 3rd ed. Boca Raton, Florida: CRC Press.
Salisbury, H. E. (2003). The 900 days: The siege of Leningrad. Cambridge, Massachusetts: Da Capo Press.
Woodham-Smith, C. (1962). The great hunger: Ireland 1845-1849. New York and Evanston: Harper & Row.