Showing posts with label china. Show all posts

Thursday, 11 February 2016

EIA's Predictions Questionable - OPEC Call is the Fudge Number!


Just How Accurate Are The EIA’s Predictions?

  
  • Mahjoub Mohamed Salih, WNN news


The EIA recently published the February edition of their Short-Term Energy Outlook. If you follow this month to month, and we do, you will notice their prognostications change a little every month. And over several months those small changes can add up to some rather dramatic changes. Nevertheless, below are several charts with their current oil production projections.
The EIA STEO only gives monthly data for total liquids. All C+C data is quarterly and annually. The monthly projected data begins in February 2016. Projections for quarterly and annual data begins January 2016.
ST Non-OPEC Liquids
The EIA says Non-OPEC total liquids dropped .5 million barrels per day in December and another .36 mbd in January. But then, other than another short drop in the first quarter of 2017, they see things leveling out for the next two years.
ST World Liquids
For the total world, the EIA expects far better production numbers than just for Non-OPEC. They expect new highs to be reached in 2016 and again in 2017.
ST US Liquids
They see US total liquids dropping in 2016 then they begin a slow rise through 2017, but not overtaking the peak in 2015.
ST Russia Liquids
Image result for putin badass
Apparently the EIA thinks Russia has had it. They see a drop in December 2016 then a huge drop in January  2017. We have no idea why. However the scale here makes the decline seem greater than it really is. From January 2015 to December 2017 the decline is only 400,000 barrels per day.
ST Eurasia Liquids

Adding the other FSU nations to the mix, mostly Azerbaijan and Kazakhstan, only exacerbates the decline, making it half a million bpd between January 2015 and December 2017.
ST Non-OPEC C+C A

Looking at just Crude + Condensate you get a better picture of what the EIA really expects in the next two years.  They expect Non-OPEC C+C to drop 580,000 bpd in 2016 and another 170,000 bpd in 2017 for a total of 750,000 bpd over the two years.
ST OPEC Total Liquids A
They are expecting far better things out of OPEC's gang.  They have the OPEC gangs total liquids up 1,010,000 barrels per day in 2016 and another 870,000 bpd in 2017. They do not project OPEC C+C.
But taking a closer look at their US Projections:
ST US C+C A
The EIA expects US C+C to drop 740,000 barrels per day in 2016 and another 230,000 bpd in 2017 for a total decline over two years of 970,000 barrels per day. 
ST US Liquids A  
However they have US total liquids faring much better then just C+C. They have total liquids declining by only 490,000 barrels per day in 2016 and increasing by 100,000 bpd in 2017.
ST US Other Liquids A
What this means is that US “Other Liquids”, that is NGLs, biofuels and refinery process gain must show a very impressive gains while everything else is going to pot. They show other liquids increasing by 250,000 bpd in 2016 and another 330,000 bpd in 2017. 
Most of this increase has to come from NGLs as biofuels are only a minor input and refinery process gain pretty much follows C+C consumption. But…
ST US Other Liquids % Increase 
Using their projections for Dry Gas production we find that gas production increased more than other liquids increased in 2015. However they say gas production will increase by only .4 percent in 2016 while other liquids increase by 4.6 percent, and a similar story in 2017 though not quite as dramatic.
Bottom line: We find the EIA’s past production data very accurate. However their projections appear to be pretty lame. This observation is proven out by the fact that those projections are constantly changing. Also, those “Other Liquids” projections seem to make no sense whatsoever. It appears to be mostly a fudge.  
Image result for yogi bear
But the very biggest problem with the EIA’s projections are with OPEC. That is because it is not a projection at all but an estimate of what will be needed to meet world demand. That is they estimate Non-OPEC production, then they estimate world demand, and the difference between the two will be the “Call on OPEC”. That is, they will simply expect OPEC to make up the difference, whatever that difference may be.
Lately, however, OPEC seems to be producing a lot more than their call asked them to. That is, they appear to be ignoring their call. And they will likely do likewise when they are expected to produce more to meet demand. They are all currently producing flat out and if there is a call on them to produce more, it will very likely go unanswered. 
WE thus  expect the “Call on OPEC” is a running joke between OPEC nations.

Image result for wile e coyote
______________________________________________________

Wednesday, 10 February 2016

OPEC January Production


OPEC January Production -

  • Mahjoub Mohamed Salih, WNN News (Arabia)


The latest OPEC Monthly Oil Market Report is just out. The the data is “Crude Only”production and do not reflect condensate production.
Also the charts, except for Libya, are not zero based. I chose to amplify the change rather than the total. The chats do not include Indonesia. That will be added within the next few months when I am able to get better historical data for Indonesian crude only production. 
All Data is in thousand barrels per day.

OPEC 12

OPEC production, not including Indonesia, was up 130,700 barrels per day in December.

MOMR Secondary Sources
OPEC uses secondary sources such as Platts and other agencies to report their production numbers. These numbers are pretty accurate and usually have only slight revisions month to month. 

Algeria
Algeria peaked in November 2007 and has been in a steady decline since that point.

Angola


Angola has been holding steady since peaking in 2008 and 2010.

Ecuador
Ecuador appears to have peaked last year. It is likely production will be down, but only slightly, in 2016.

Iran

Sanctions were just lifted, in the middle of January, on Iran. I expect their production to be up by about half a million barrels per day by year’s end. However I believe Iran will be the only OPEC nation with any significant production increase in 2016. Most other OPEC countries will, I believe, be flat to down slightly.

Iraq
Iraq increased production more than any other OPEC nation in 2015. However I believe their increase in 2016 will be very moderate, if any.

Kuwait
I expect Kuwait will continue its slow decline from its peak in 2013. 

Libya
Libya is struggling with their own Arab Spring. There is no way of knowing when, if ever, peace will break out there. I think it extremely unlikely they will produce as much as 1,000,000 bpd within the next 5 years or so.Nigeria
Nigeria is struggling with their own political revolution. But it appears they are in decline regardless of their political problems. However they had the largest increase in January, up 74,000 bpd.
Saudi Arabia

I believe Saudi is producing every barrel they possibly can. They will be lucky to hold this level for much longer.

Qatar
Qatar has lots of natural gas but their oil production has clearly peaked and is now in decline.

UAE
From 2005 through 2010 the oil rig count in the UAE averaged around 12. In November their oil rig count stood at 48,  4 times their average. They have managed to increase their production about 11% above their 2008 peak. I believe UAE production is about to follow Kuwait’s lead and rollover. The UAE’s rig count stood at 44 in January.
Venezuela

Not much can be said about Venezuela. Their conventional oil is in decline but their bitumen production is keeping production relatively flat. They took a hit in January however, down 34,500 bpd.
OPEC Less Saudi & Iraq

The combined production of OPEC, less Saudi Arabia and Iraq, peaked in January 2008 at 19,931,000 bpd and is down 2,778,000 bpd since that date 17,153,000 bpd.

saudi + Iraq
Since the combined production of the other OPEC 10 nations peaked in January 2008, Saudi and Iraq have increased their production by 3,625 bpd, from 10,850,000 bpd to 14,475,000 bpd. That is 33,000 bpd below their peak in June 2015.
Again, none of this data includes Indonesia. Historical crude only data for Indonesia is not available. I will include Indonesia in OPEC charts when I can calculate those numbers.

OPEC Annual Average
OPEC average crude only production in 2015 was 31,152,000 barrels per day. In January their production was 31,628,000 barrels per day.

MOMR Non-OPEC Supply
OPEC expects Non-OPEC liquids production to be down 720,000 barrels per day in 2016. If OPEC manages to hold production relatively flat from January, their 2016 production will be up 475,000 bpd. That is their gain would be about 250,000 bpd short of Non-OPEC’s decline.
However I expect OPEC to be slightly up this year due to Iran increasing production. But the increase will be modest as the rest of OPEC will likely be down. However I believe Non-OPEC will be down a lot more than 720,000 barrels per day.
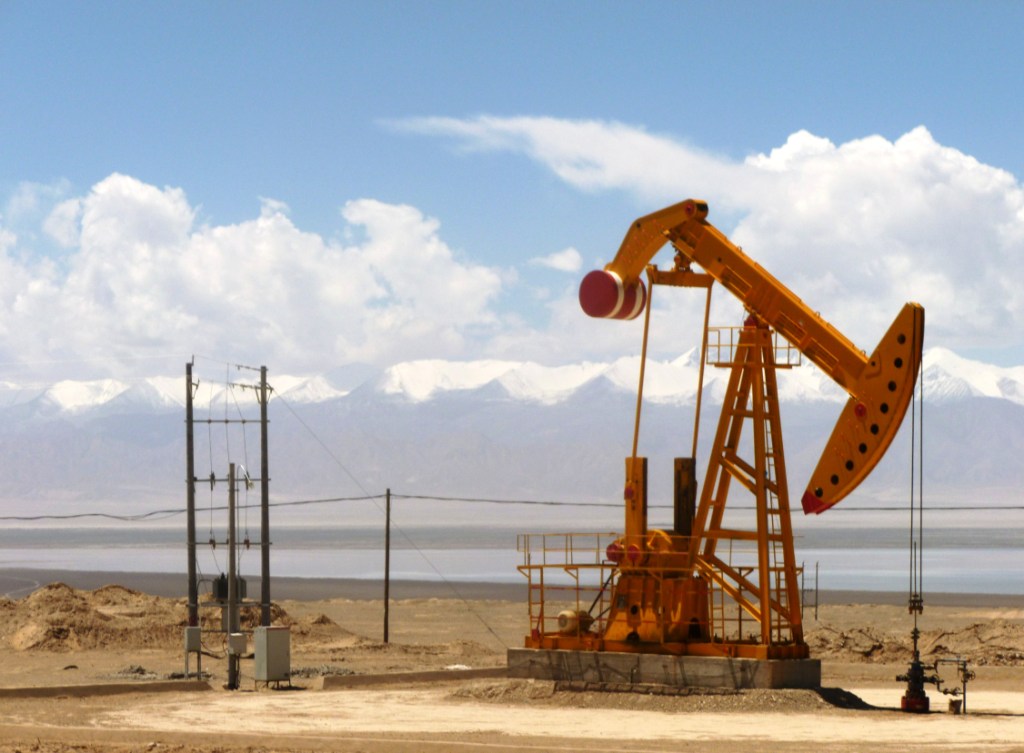
China, the world’s fifth largest oil producer, has peaked and will suffer a sharp decline in 2016.
China’s role as a big oil consumer has become a crucial factor in energy markets in recent years. Now, its role as a major producer is gaining attention as well.
China is among the world’s top five oil producers, but its fields are growing depleted and are increasingly expensive to pump. The country’s leading companies are choosing to leave more of their oil in the ground and some analysts now say Chinese oil output may have peaked.
Cnooc Ltd., China’s third-largest oil producer–which produces most of its oil from offshore fields–also said last month it expected output to decline by 5% this year, after years of rapid growth.

As China’s production starts to decline, demand for oil from overseas should remain firm, which would be good news for prices, which have been languishing near multi-year lows amid a global supply glut and weak demand in the rest of the world.


    • dd

Thursday, 27 August 2015

Greenspan Warns Exuberant " Bond Bubble To Bust" & More Top Insights

Greenspan warns about bond-market bubble


: Former Federal Reserve Chairman Alan Greenspan is sounding the alarm about a bubble that he believes is forming in the bond market.
In two television interviews in recent days, Greenspan said interest rates could shoot higher and derail the economy when the bubble bursts.
The former Fed chairman says the current situation in the bond market is comparable to what happens in the stock market during an equity bubble.
Noting that stock-market bubbles are typically characterized by extreme price-to-earnings ratios, Greenspan said extremely low yields are telling a similar tale for bonds.
“If you turn the bond market around and you look at the price of bonds relative to the interest received by those bonds, that looks very much like the usual spread which would concern us if it were equities, and we should be concerned,” Greenspan said in an interview with Fox Business Network.


There are China analysts, and then there is Charlene Chu.
She has been called a rock star of Chinese-debt analysis. Money managers the world over pay tens of thousands of dollars for access to her research at her new firm Autonomous Research. Her reports are rarely leaked, and she rarely gives interviews.

Business Insider got a glimpse at a massive report she wrote at the end of July.

This was when everyone was freaking out about the precipitous fall of China's stock markets, and it predates the Chinese authorities' decision to devalue the yuan.

Her base case in the report was for Chinese authorities to maintain stability of the equity market and forestall contagion.There is also a doomsday scenario, however, in which there is contagion to other domestic and international markets, large capital outflows, and an acceleration of problems associated with financial-sector weakness and corporate indebtedness.

The report said: "This in turn would likely lead to a significant pullback in credit, putting the brakes on GDP growth and bringing an end to China's decades of stellar economic growth. At that point, social and political stability — the critical wild cards in this equation — could come under question."

This is what doom looks like


Growth in OPEC’s biggest exporter will slow to 2.8 percent this year and 2.4 percent in 2016 after oil prices slumped, the Washington-based IMF said in a statement on Monday. If spending isn’t curbed, its fiscal deficit would be “very large” this year and over the medium term, it added.


“Moody’s isn’t the only one predicting that growth will be slow to rebound,” said Ari Santos, a trader at Sao Paulo-based brokerage H.Commcor. “Looking forward, we’ll have a stagnant economy, with no growth and no outlook to grow.”


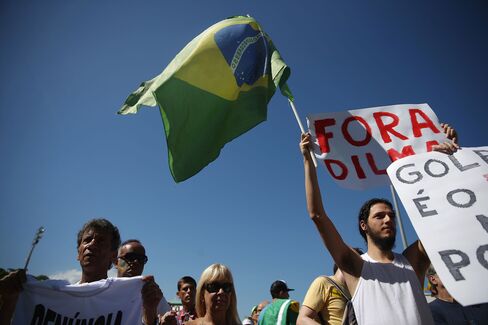
Protesters calling for the impeachment of President Dilma Rousseff march along Copacabana beach on Aug. 16, 2015.
In the midst of its deepest economic and political crisis in a generation, Brazil is contending with a business climate so punishing that major projects across numerous sectors are being frozen or shrunk, while small businesses slash prices and shift focus.


Singapore-based wealth managers, already under pressure from a global move towards tax information sharing, face a more immediate threat as Asian countries including Indonesia and India look to chase undeclared money in the low-tax city state. A global crackdown on tax evasion launched during the 2008 financial crisis has already forced Switzerland and other European offshore hubs to surrender their prized bank secrecy.


The combined deficit of private sector DB schemes in the UK

 now stands at around £900 billion, up from £250 billion

 since the start of the millennium, despite companies pouring

 in £500 billion towards pension saving over that time.

 According to Hymans Robertson, the stark figures highlight

 that for too long pension schemes have been taking too 

much risks


Originally Published

 Investors' Insights 

http://pwa2100.blogspot.ca/2015/08/greenspan-warns-exuberant-bond-bubble.html

Sunday, 26 July 2015

Reality Check - Oil and Energy Shortages Behind Global Finance Woes, & More


What Greece, Cyprus, and Puerto Rico Have in Common


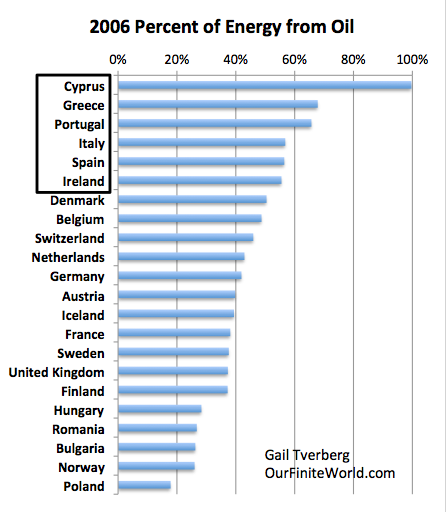
We all know one thing that Greece, Cyprus, and Puerto Rico have in common–severe financial problems. There is something else that they have in common–a high proportion of their energy use is from oil. Figure 1 shows the ratio of oil use to energy use for selected European countries in 2006.

Figure 1. Oil as a percentage of total energy consumption in 2006, based on June 2015 Energy Information data. (Inverted order from chart originally shown.)

Greece and Cyprus are at the bottom of this chart. The other “PIIGS” countries (Ireland, Spain, Italy, and Portugal) are immediately above Greece. Puerto Rico is not European so is not on Figure 1, but it if were shown on this chart, it would appear between Greece and Cyprus–its oil as a percentage of its energy consumption was 98.4% in 2006. The year 2006 was chosen because it was before the big crash of 2008. The percentages are bit lower now, but the relationship is very similar now.


In my last several crude oil updates, I showed that the “smart money” was betting against crude oil’s rebound that started in March, while the “dumb money” was the main driving force behind it. I have been skeptical of oil’s rebound due to persistently high inventories and the still-sizable long position held by speculators even after last year’s oil crash. Light sweet crude oil sank 7.6 percent during last week’s China-induced commodities rout and because active oil rigs rose for a second straight week after months of declines.

BrentCrude

West Texas Intermediate (WTI) crude oil broke down from its wedge patternthat I showed in late-June, and is now sitting just above its key $50 per barrel support level. If WTI crude breaks decisively below its $50 support level, a resumption of the 2014 oil bear market is quite possible. WTI crude may be forming a flag pattern that could indicate further declines if broken to the downside.

Oil Imports Have Energy Poor Greece In A Stranglehold


After several years, several months, several weeks and several days of crisis, it looks like things are about to come to a head for Greece and its banks. It becomes easier to understand exactly what GREXIT may mean for the Greek people. What happens when the banks and the government completely run out of money?
Greece has some indigenous coal production (lignite) but no oil or gas to speak of which means that all oil and gas are imported (Figure 1). This is linked to a structural trade deficit that contributes to the country’s dependency on debt. If Greece runs out of Euros, will it be able to buy oil and gas on the international markets? Greece held 90 days of oil stocks in 2010 [2]. Once that is gone then the tourist industry may collapse?

Carl Icahn Believes “There Really Is A Bubble Brewing”


Billionaire investor Carl Icahn spoke with FOX Business Network’s (FBN) Neil Cavuto and Trish Regan about the economy, saying “I believe that there really is a bubble brewing.” He went on to say that we are in “unchartered territory,” with historically low interest rates, and “a market that’s going up artificially,” which “could be very destructive to our markets and our economy.” When asked about what the Federal Reserve should do, Icahn said, “stop worrying what the markets will do,” and “start raising rates right now.” He went on to say that the “Fed is really pandering to a lot of these guys on Wall Street that they really shouldn’t be pandering to.” Regarding whether he’d take the role of Treasury Secretary, as Donald Trump suggested,” Icahn said, “I guess I would not. I sleep too late.”


The Greek Parliament is seen during a protest in Athens last night.
Two days of high-stakes negotiations between the finance ministers of the currency bloc resulted in a four-page document that included controversial German elements leaked on Saturday. Those measures included Greece leaving the euro temporarily by taking a “time-out” from the currency bloc if it refuses terms for talks on the new bailout or, in the event of agreement, that Greece sets aside €50bn worth of assets as collateral for new loans and for eventual privatisation. Both passages, however, did not enjoy a consensus among eurozone leaders.

4_jpgWhat is not an illusion is the extreme trouble many EU countries are in. Besides Greece, Spain and Italy are deep in debt. Smith contends, “Spain’s debt is a trillion euros. Italy is over a trillion euros in debt. We are talking fairly serious money here.”

China’s market is also shaped by the heavy hand of the government, which makes decisions about what companies can list shares, when to promote stock rallies and, now, how to intervene when prices plummet. The government, in other words, views the market as a policy instrument, a mechanism to fulfill its political and economic goals. The result can be a volatile market that swings from boom to bust.


Did You Hear?