Wednesday, 10 February 2016

Physics Sets the Stage For Economic Collapse

The Physics of Energy and the Economy

I approach the subject of the physics of energy and the economy with some trepidation. An economy seems to be a dissipative system, but what does this really mean? There are not many people who understand dissipative systems, and very few who understand how an economy operates. The combination leads to an awfully lot of false beliefs about the energy needs of an economy.
The primary issue at hand is that, as a dissipative system, every economy has its own energy needs, just as every forest has its own energy needs (in terms of sunlight) and every plant and animal has its own energy needs, in one form or another. A hurricane is another dissipative system. It needs the energy it gets from warm ocean water. If it moves across land, it will soon weaken and die.
There is a fairly narrow range of acceptable energy levels–an animal without enough food weakens and is more likely to be eaten by a predator or to succumb to a disease. A plant without enough sunlight is likely to weaken and die.
In fact, the effects of not having enough energy flows may spread more widely than the individual plant or animal that weakens and dies. If the reason a plant dies is because the plant is part of a forest that over time has grown so dense that the plants in the understory cannot get enough light, then there may be a bigger problem. The dying plant material may accumulate to the point of encouraging forest fires. Such a forest fire may burn a fairly wide area of the forest. Thus, the indirect result may be to put to an end a portion of the forest ecosystem itself.
How should we expect an economy to behave over time? The pattern of energy dissipated over the life cycle of a dissipative system will vary, depending on the particular system. In the examples I gave, the pattern seems to somewhat follow what Ugo Bardi calls a Seneca Cliff.
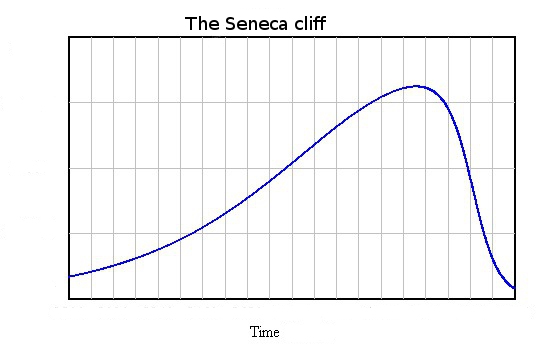
Figure 1. Seneca Cliff by Ugo Bardi
Figure 1. Seneca Cliff by Ugo Bardi
The Seneca Cliff pattern is so-named because long ago, Lucius Seneca wrote:
It would be some consolation for the feebleness of our selves and our works if all things should perish as slowly as they come into being; but as it is, increases are of sluggish growth, but the way to ruin is rapid.

The Standard Wrong Belief about the Physics of Energy and the Economy
There is a standard wrong belief about the physics of energy and the economy; it is the belief we can somehow train the economy to get along without much energy.

In this wrong view, the only physics that is truly relevant is the thermodynamics of oil fields and other types of energy deposits. All of these fields deplete if exploited over time. Furthermore, we know that there are a finite number of these fields. Thus, based on the Second Law of Thermodynamics, the amount of free energy we will have available in the future will tend to be less than today. This tendency will especially be true after the date when “peak oil” production is reached.
According to this wrong view of energy and the economy, all we need to do is design an economy that uses less energy. We can supposedly do this by increasing efficiency, and by changing the nature of the economy to use a greater proportion of services. If we also add renewables (even if they are expensive) the economy should be able to get along fine with very much less energy.
These wrong views are amazingly widespread. They seem to underlie the widespread hope that the world can reduce its fossil fuel use by 80% between now and 2050 without badly disturbing the economy. The book 2052: A Forecast for the Next 40 Years by Jorgen Randers seems to reflect these views. Even the “Stabilized World Model” presented in the 1972 book The Limits to Growth by Meadow et al. seems to be based on naive assumptions about how much reduction in energy consumption is possible without causing the economy to collapse.


The Economy as a Dissipative System
If an economy is a dissipative system, it needs sufficient energy flows. Otherwise, it will collapse in a way that is analogous to animals succumbing to a disease or forests succumbing to forest fires.


The primary source of energy flows to the economy seems to come through the leveraging of human labor with supplemental energy products of various types, such as animal labor, fossil fuels, and electricity. For example, a man with a machine (which is made using energy products and operates using energy products) can make more widgets than a man without a machine. A woman operating a computer in a lighted room can make more calculations than a woman who inscribes numbers with a stick on a clay tablet and adds them up in her head, working outside as weather permits.
As long as the quantity of supplemental energy supplies keeps rising rapidly enough, human labor can become increasingly productive. This increased productivity can feed through to higher wages. Because of these growing wages, tax payments can be higher. Consumers can also have ever more funds available to buy goods and services from businesses. Thus, an economy can continue to grow.
Besides inadequate supplemental energy, the other downside risk to continued economic growth is the possibility that diminishing returns will start making the economy less efficient. These are some examples of how this can happen:
  • Deeper wells or desalination are needed for water because aquifers deplete and population grows.
  • More productivity is needed from each acre of arable land because of growing population (and thus, falling arable land per person).
  • Larger mines are required as ores of high mineral concentration are exhausted and we are forced to exploit less productive mines.
  • More pollution control devices or higher-cost workarounds (such as “renewables”) are needed as pollution increases.
  • Fossil fuels from cheap-to-extract locations are exhausted, so extraction must come from more difficult-to-extract locations.
In theory, even these diminishing returns issues can be overcome, if the leveraging of human labor with supplemental energy is growing quickly enough.
Theoretically, technology might also increase economic growth. The catch with technology is that it is very closely related to energy consumption. Without energy consumption, it is not possible to have metals. Most of today’s technology depends (directly or indirectly) on the use of metals. If technology makes a particular type of product cheaper to make, there is also a good chance that more products of that type will be sold. Thus, in the end, growth in technology tends to allow more energy to be consumed.
Why Economic Collapses Occur

Read More

Or 

Related and Recommended
Paradise Lost
by 
Paul Chefurka 
 Or 

"Watch A Related Recommended Video"


OPEC January Production


OPEC January Production -

  • Mahjoub Mohamed Salih, WNN News (Arabia)


The latest OPEC Monthly Oil Market Report is just out. The the data is “Crude Only”production and do not reflect condensate production.
Also the charts, except for Libya, are not zero based. I chose to amplify the change rather than the total. The chats do not include Indonesia. That will be added within the next few months when I am able to get better historical data for Indonesian crude only production. 
All Data is in thousand barrels per day.

OPEC 12

OPEC production, not including Indonesia, was up 130,700 barrels per day in December.

MOMR Secondary Sources
OPEC uses secondary sources such as Platts and other agencies to report their production numbers. These numbers are pretty accurate and usually have only slight revisions month to month. 

Algeria
Algeria peaked in November 2007 and has been in a steady decline since that point.

Angola


Angola has been holding steady since peaking in 2008 and 2010.

Ecuador
Ecuador appears to have peaked last year. It is likely production will be down, but only slightly, in 2016.

Iran

Sanctions were just lifted, in the middle of January, on Iran. I expect their production to be up by about half a million barrels per day by year’s end. However I believe Iran will be the only OPEC nation with any significant production increase in 2016. Most other OPEC countries will, I believe, be flat to down slightly.

Iraq
Iraq increased production more than any other OPEC nation in 2015. However I believe their increase in 2016 will be very moderate, if any.

Kuwait
I expect Kuwait will continue its slow decline from its peak in 2013. 

Libya
Libya is struggling with their own Arab Spring. There is no way of knowing when, if ever, peace will break out there. I think it extremely unlikely they will produce as much as 1,000,000 bpd within the next 5 years or so.Nigeria
Nigeria is struggling with their own political revolution. But it appears they are in decline regardless of their political problems. However they had the largest increase in January, up 74,000 bpd.
Saudi Arabia

I believe Saudi is producing every barrel they possibly can. They will be lucky to hold this level for much longer.

Qatar
Qatar has lots of natural gas but their oil production has clearly peaked and is now in decline.

UAE
From 2005 through 2010 the oil rig count in the UAE averaged around 12. In November their oil rig count stood at 48,  4 times their average. They have managed to increase their production about 11% above their 2008 peak. I believe UAE production is about to follow Kuwait’s lead and rollover. The UAE’s rig count stood at 44 in January.
Venezuela

Not much can be said about Venezuela. Their conventional oil is in decline but their bitumen production is keeping production relatively flat. They took a hit in January however, down 34,500 bpd.
OPEC Less Saudi & Iraq

The combined production of OPEC, less Saudi Arabia and Iraq, peaked in January 2008 at 19,931,000 bpd and is down 2,778,000 bpd since that date 17,153,000 bpd.

saudi + Iraq
Since the combined production of the other OPEC 10 nations peaked in January 2008, Saudi and Iraq have increased their production by 3,625 bpd, from 10,850,000 bpd to 14,475,000 bpd. That is 33,000 bpd below their peak in June 2015.
Again, none of this data includes Indonesia. Historical crude only data for Indonesia is not available. I will include Indonesia in OPEC charts when I can calculate those numbers.

OPEC Annual Average
OPEC average crude only production in 2015 was 31,152,000 barrels per day. In January their production was 31,628,000 barrels per day.

MOMR Non-OPEC Supply
OPEC expects Non-OPEC liquids production to be down 720,000 barrels per day in 2016. If OPEC manages to hold production relatively flat from January, their 2016 production will be up 475,000 bpd. That is their gain would be about 250,000 bpd short of Non-OPEC’s decline.
However I expect OPEC to be slightly up this year due to Iran increasing production. But the increase will be modest as the rest of OPEC will likely be down. However I believe Non-OPEC will be down a lot more than 720,000 barrels per day.
China, the world’s fifth largest oil producer, has peaked and will suffer a sharp decline in 2016.
China’s role as a big oil consumer has become a crucial factor in energy markets in recent years. Now, its role as a major producer is gaining attention as well.
China is among the world’s top five oil producers, but its fields are growing depleted and are increasingly expensive to pump. The country’s leading companies are choosing to leave more of their oil in the ground and some analysts now say Chinese oil output may have peaked.
Cnooc Ltd., China’s third-largest oil producer–which produces most of its oil from offshore fields–also said last month it expected output to decline by 5% this year, after years of rapid growth.

As China’s production starts to decline, demand for oil from overseas should remain firm, which would be good news for prices, which have been languishing near multi-year lows amid a global supply glut and weak demand in the rest of the world.


    • dd

Sunday, 7 February 2016

Energy 2050 Apocalypse - The Road to Exhaustion (Part 6)

Energy 2050 Apocalypse


World Energy to 2050
  Forty Years of Decline
Putting Energy Sources in Perspective
Part 6
By Paul Cherfurka
http://www.paulchefurka.ca/


Putting Energy Sources in Perspective


Figure 11: Energy Use by Source, 1965 to 2100


Figure 11 shows all the above curves on a single graph, giving us a sense of the relative timing of the various production peaks as well as the rates of increase or decline of the different sources. As you can see, fossil fuels are by far the most important contributors to the world's current energy mix, but oil and natural gas will decline rapidly over the coming decades. By the middle of the century the dominant player is coal, with oil, gas, hydro, nuclear power and renewables making very similar contributions to the world's mid-century energy supply.


Figure 12: The Global Energy Mix in 1965, 2005 and 2050


Figure 12 shows the changing contribution of each energy source relative to the others over time.  There are three interesting things to note about this progression.

The first is the large role that coal plays in the global supply picture.  That situation is not entirely unexpected, but it hints at the difficulty we will have trying to replace our dirtiest and most dangerous energy source as our supplies of oil and gas decline.

The second is the increasing diversity of energy sources over time.  This change is a good thing, as it indicates that various regions will have a much wider range of energy options available to them than in the past.

Finally, by mid-century energy sources that do not generate greenhouse gases may be supplying 40% of the world's power as opposed to 13% today and only 5% in 1965.  Combined with an overall (albeit involuntary) reduction in global energy use by 2050, that shift bodes well for reducing the carbon dioxide our civilization exhales into the atmosphere.


Figure 13: Total Energy Use, 1965 to 2100


Figure 13 has all the energy curves added together to show the overall shape of total world energy consumption. This graph aggregates all the rises, peaks and declines to give a sense of the complete energy picture.  The graph shows a strong peak in about 2020, with an ongoing decline out to 2050. The main reason for the decline is the loss of oil and gas. The decline is cushioned by an increase in hydro and renewables over the middle of the century, and averages out to 1% per year.


Fuel vs. Electricity


The energy we use can be broadly categorized into two classes, fuel and electricity.  The former consists of oil and gas, the two sources that will be in decline over the next half century.  The amount of electricity we produce from all other sources including coal will increase, though not enough to offset the decline in fuels in terms of the energy they supply.  Figure 14 shows show how the split between the two classes of energy will change over the next 45 years.


Figure 14: Fuel and Electricity Use, Today and 2050

In addition to the loss of transportation mobility it represents, the loss of the enormous contributions of oil and natural gas means that the total amount of energy available to humanity by the middle of the century may be only 70% of the amount we use now. That shortfall contains an ominous message for our future that is the subject of the next section.

Image result for horse and buggy 1800s

Next
Part 7: Effects and Conclusion
(February 27, 2016)

Friday, 5 February 2016

ALERT: Oil Prices Set to Rise Sharply


Oil Production Going to Drop; Oil Prices Likely To Increase


The two below Rystad charts were published by CNN Money on November 23, 2015.

Costs, Overall
This is overall or average cost, not marginal cost. It cost Canada $41 to produce a barrel of oil but only cost Russia $17.20. I guess that is why Canada is cutting back but Russia is not.
Costs, Breakdown

 Here is the breakdown between capital expenditures and operational expenditures. Why would the United Kingdom’s operational expenditures be two and one half times those of Norway? After all, they are both drilling basically the same oil field.
So why is not the price of oil having a more dramatic effect on production? Well it is, it just takes a while. Here are some plans from about a year and a half ago, when the price of oil was much higher.
Rystad published the two below charts in their US Shale Newsletter in January 2015 but the data dates from the 4th quarter of 2014, just as the price of oil had started to drop.

Cost per Play
At that time Bakken (ND) had a break even price of $53 while Eagle Ford oil had a break even price of $42 and Eagle ford condensate a break even price of $50.
The below chart, from the same newsletter, assumes $90 a barrel oil.

Costs, Startup
Shale oil, at the time, had an average break even price of $65 a barrel, which would have given them a 45% internal rate of return and a payback time of only 2 years. It is amazing how much things have changed in just a little over a year.
But by October 2015 things had changed dramatically.
Global offshore oil production in aging fields will fall by 10 percent next year as producers abandon field upgrades at the fastest rate in 30 years, in the first clear sign of output cuts outside the U.S. shale industry, exclusive data shows.
A drop in oil prices to half the level of a year ago has forced producers to slash spending and scrap mega projects that can take up to a decade to develop, but they are also taking less visible steps to cut investment in existing fields that will have an immediate impact on global supplies.
There have been few signs of how cost cuts of around $180 billion will impact near-term production until now. They could erode the glut that has forced down prices, and help balance global production and demand by the middle of next year or earlier, Oslo-based oil consultancy Rystad Energy said.
Data provided exclusively to Reuters by Rystad show a sharp decline in investment to upgrade mature offshore oil fields in order to arrest their natural decline, in what is known as infill drilling.(Graphic: link.reuters.com/xaz75w)


Costs, Infill Drilling Decline
The above chart shows the decline in infill drilling due to previous drops in the price of oil. The data is from the Gulf of Mexico, Southeast Asia and Brazil. The decline in infill drilling in 2009 was the largest… until now. The first half of 2015 saw the largest decline in offshore infill drilling in history.
In three major offshore basins — the Gulf of Mexico, Southeast Asia and Brazil — infill drilling dropped by 60 percent between January and July this year compared with the same period last year, according to the Rystad Oil Market Trend Report, whose data is based on company data and regulatory filings.
For example, according to the data, in the Gulf of Mexico, infill drilling on mature wells dropped from 149 wells between January and July 2014 to a total of 61 wells during the same period this year.
Based on this trend, Rystad Energy estimates that global offshore oil production in mature field will decline next year by 1.5 million barrels per day (bpd), or 10 percent, to 13.5 million bpd from 15 million bpd in 2015.

Costs Infill drilling 1
The above chart is change per operator, just in the GOM. And this was just in the first half of 2015 when the price of oil averaged about $56 a barrel. What is it now when the price of oil is over $20 a barrel lower?
Well, just since June Wood Mackenzie says the latest figures show that the amount of deferred capital spending on projects awaiting approval has almost doubled from $200bn to $380bn, with 2.9m barrels a day of liquids production now not due to come on stream until early in the next decade.
*The break-even price is the Brent oil price at which NPV equals zero using a real discount rate of 7.5%. Resources are split into two life cycle categories: producing and non-producing (under development and discoveries). the latter is further split into several supply segment groups. The curve is made up of more than 20,000 unique assets based on each asset’s break-even price and remaining liquids resources in 2015.
Source: Rystad Energy UCube September 2015


What the above chart tells me is that it now costs a lot more to produce a barrel than it once did. And… unless crude oil hits at least $60 a barrel soon a lot more projects will have to be cancelled. But… all that being said, I think it is now obvious that oil production will drop, rather dramatically, beginning sometime in 2016. And that drop will lead to a rise in the price of oil, at least to $60 a barrel and likely higher.

That is unless some black swan event happens. That could be a collapse in several economies of the world… or a collapse of the economy in one country, China. In other words, it is a given that production is going to decline. So if demand stays constant, or rises, then the price of oil will definitely rise. We know what is going to happen to supply. We have no idea what is going to happen to demand.

 But if BAU continues as normal, the price of oil is going up.


"Now is there anything else that we should worry about?" 

Jack Feanhald, WWN News

Image result for skyrocketing 0il prices


An Important Video Worth Watching